

Reduce Beam Section
Table of Contents
- Introduction
1.2 Reduce Beam Section
- Experimental Specimen Specifications
2.1 Geometric Properties
2.2 Material Properties
2.3 Experiment Loading Systems
- Finite Element Modeling (ANSYS APDL)
- Overview of ANSYS APDL
- Modeling (Step-by-Step)
- Results Comparison
2.4 Result of Experiment Test
4.1 Quantitative Data
- Conclusion
1. Introduction
This report presents the validation process of a Finite Element (FE) model developed to simulate the structural behavior of a steel moment connection with Reduced Beam Section (RBS). The objective is to verify the accuracy of the numerical model by comparing its response with experimental data obtained from laboratory testing.
The validation approach focuses on key structural response parameters, including load capacity, deformation pattern, and hysteretic behavior, to assess the ability of the FE model to reproduce the observed experimental performance. A strong correlation between the numerical and experimental results provides confidence in the model’s predictive capabilities.
1.2 Reduce Beam Section
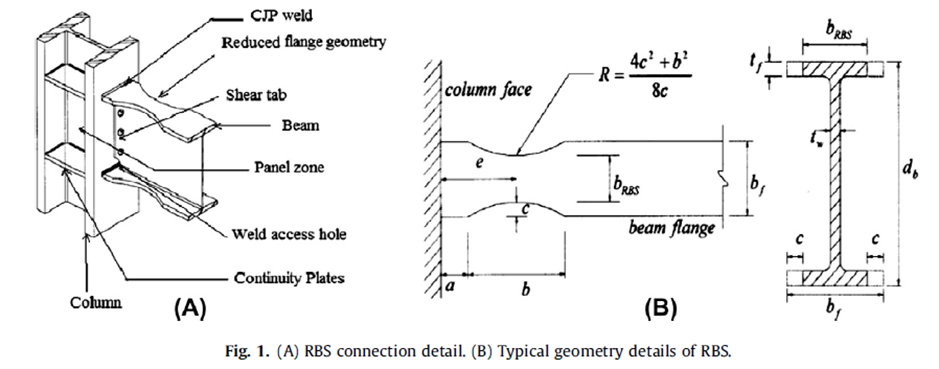
The Reduced Beam Section (RBS) connection is a seismic moment connection designed to improve ductility by forcing plastic hinging to occur away from the column face. In this system, portions of the beam flanges are intentionally reduced near the connection region, which decreases the flexural strength locally and helps protect the welds at the beam-to-column interface.
RBS connections are widely used in seismic-resistant moment frames because they promote stable inelastic response, reduce stress concentration at the joint, and enhance overall energy dissipation capacity.
2. Experimental Specimen Specifications
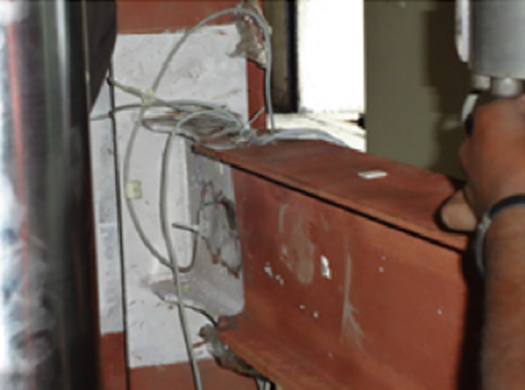
To perform model validation, it is essential to identify a laboratory specimen for which primary data and experimental results are available and reliable. In this study, the selected reference is “Study of steel moment connection with and without reduced beam section” by Swati Ajay Kulkarni and Gaurang Vesmawala, published in Case Studies in Structural Engineering (2014).
This report aims to validate the FE model against the experimental data of the RBS specimen reported in that study.
2.1 Geometric Properties
The specimen was an external steel moment connection consisting of one beam and one column. The connection geometry is as follows:
- Column section: WPB150(15)
- Beam section: NPB200(9)
Dimensions of the specimen:
- Column height: 975 mm –Fix to Fix Height: 900 mm
- Beam length from column center: 1000 mm
Section properties:
- Column (WPB150):
- Depth d=162 mm
- Web thickness tw=8 mm
- Flange width bf=154 mm
- Flange thickness tf=11.5 mm
- Beam (NPB200):
- Depth d=200 mm
- Web thickness tw=5.6 mm
- Flange width bf=100 mm
- Flange thickness tf=8.5 mm
RBS dimensions:
- a=60 mm
- b=160 mm
- c=25 mm
- Radius R=140.5 mm
2.2 Material Properties
According to the reference article, the material properties are:
- Beam (NPB200):
- Yield strength Fy=330 Mpa
- Ultimate strength Fu=484 Mpa
- Column (WPB150):
- Yield strength Fy=334 Mpa
- Ultimate strength Fu=486 Mpa
For numerical analysis, the following general material constants were used:
- Young’s modulus: E=2×10⁵ Mpa
- Poisson’s ratio: ν=0.3
2.3 Experiment Loading Systems
The test specimen was fixed at the bottom of the column, and a hydraulic actuator was used to apply cyclic horizontal displacement at the free end of the beam.
2.4 Result of Experiment Test
The key performance characteristic of the RBS connection is the relationship between applied load and beam tip displacement, which defines the capacity curve of the specimen.
This curve is used to evaluate the connection’s strength, ductility, and hysteretic response under cyclic loading.
3. Finite Element Modeling (ANSYS APDL)
3.1 Overview of ANSYS APDL
ANSYS Parametric Design Language (APDL) is a powerful scripting language used to automate the finite element analysis process. Unlike the standard GUI, APDL allows for high-precision parametric modeling, which is essential for structural validation. It offers advanced capabilities for defining complex geometries, material behaviors, and loading conditions, ensuring that the numerical model accurately represents the experimental setup.
Advantages of using APDL Scripting:
• Automation: Enables seamless iteration of geometry, mesh density, and boundary conditions, supporting complex parametric studies and optimization through scripting.
• Flexibility: Offers precise control over material nonlinearities, advanced contact elements, and custom loading protocols.
Repeatability: Ensures that modeling steps are documented and•
reproducible, reducing human error and crucial for validation studies.
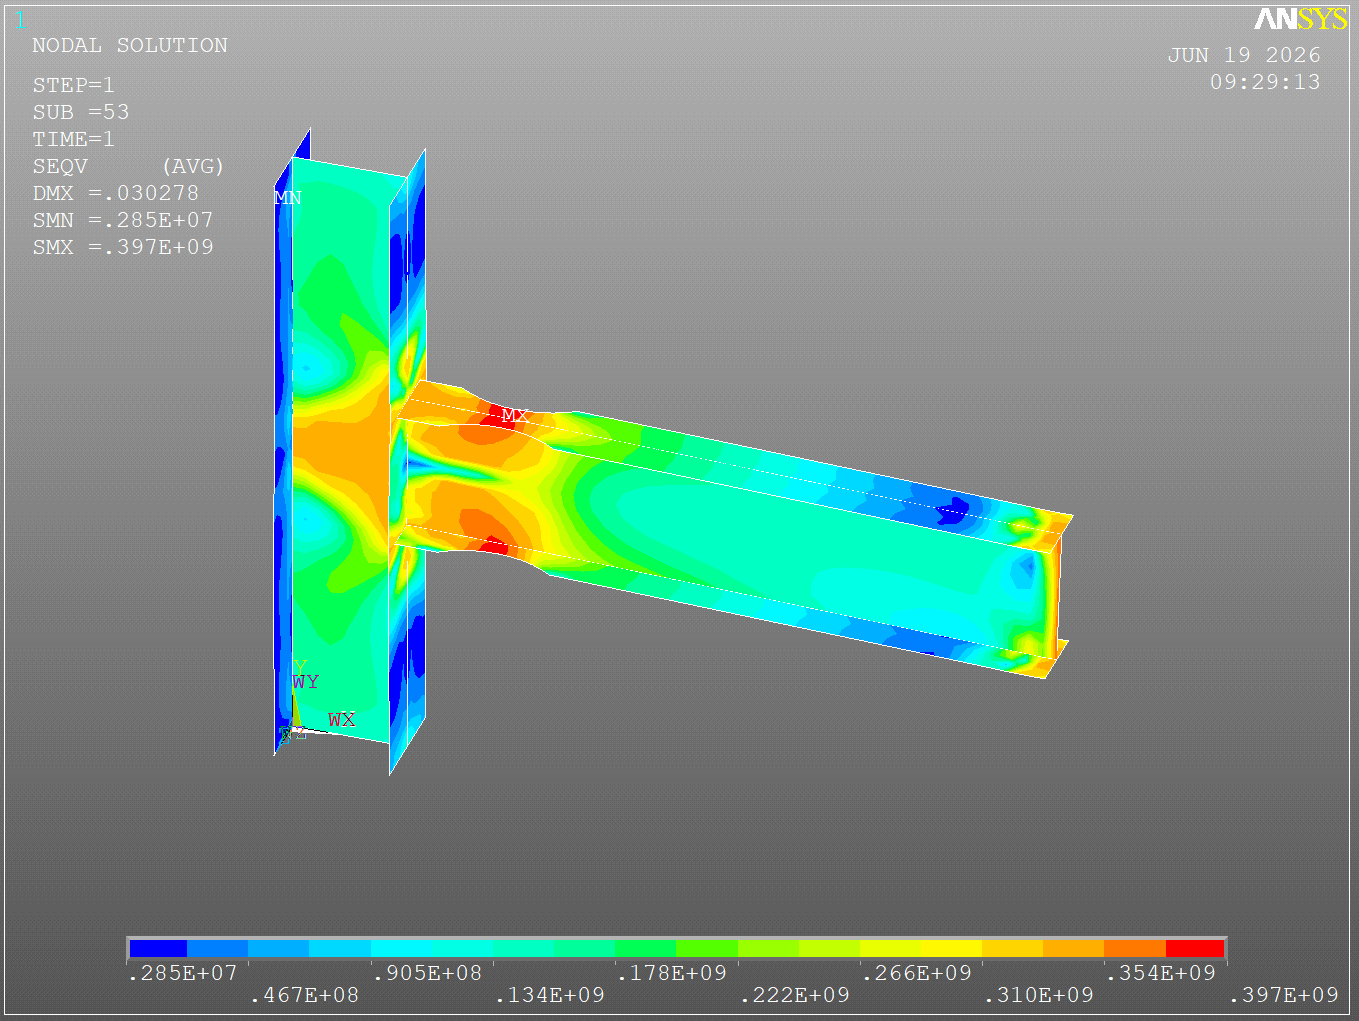
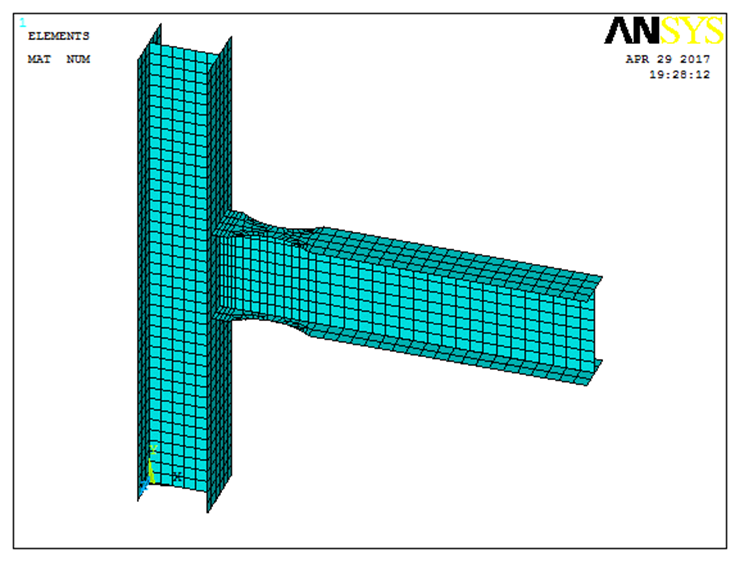
Figure 2: Modeling Experimental Specimen in ANSYS
- Modeling (Step-by-Step)
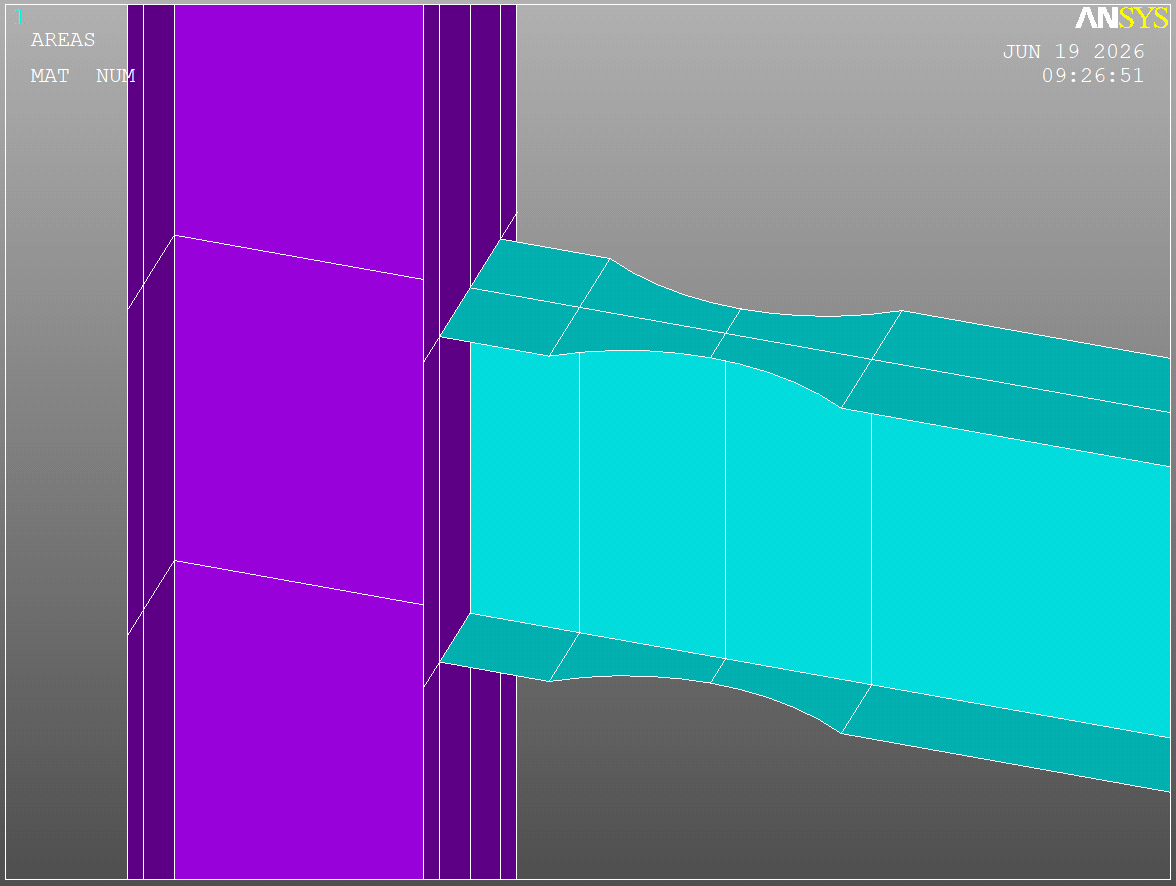
Step by Step modeling Reduce Beam Section in ANSYS
Use 4 Real Constant for Supply Thickness of Element
| Topic | No. Real Constant | Value(m) | |
| Column | Thickness of Web | 1 | 0.008 |
| Thickness of Flange | 2 | 0.0115 | |
| Beam | Thickness of Web | 3 | 0.0056 |
| Thickness of Web | 4 | 0.0085 |
Figure 2: Guide for draw Area by Dimension Method
| Step | Description’s | |
| 1: Element For Column, Beam | SHEEL43[1] | |
| 2:Material For Column, Beam | Material 1&2 Define Multilinear Material[2] | |
| 3:Modeling | Area Method | |
| 4:Meshing | Quad Mapped | |
| 5:Load, Constraint and Analysis Type | Nonlinear static Analysis by Displacement Control | |
| 6:Result | Plot and Capacity Curve |
Figure 2: Plot Result after Analysis
Figure 2: Finite Element Model Result
4. Results Comparison
4.1 Quantitative Data
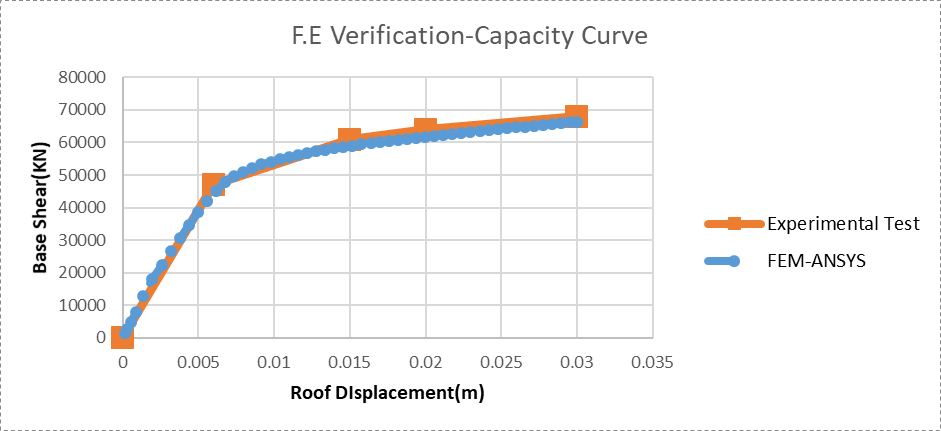
Figure 3: Load-Displacement Curve Comparison Graph
The comparison between the experimental and numerical results indicates that the FE model captures the overall structural response with satisfactory accuracy.
| Comparison Parameter | Experimental | FEA Result | Error[3] |
| Result | (ANSYS) | (%) | |
| Peak Load (N) | 68000 | 66400 | 2.5 |
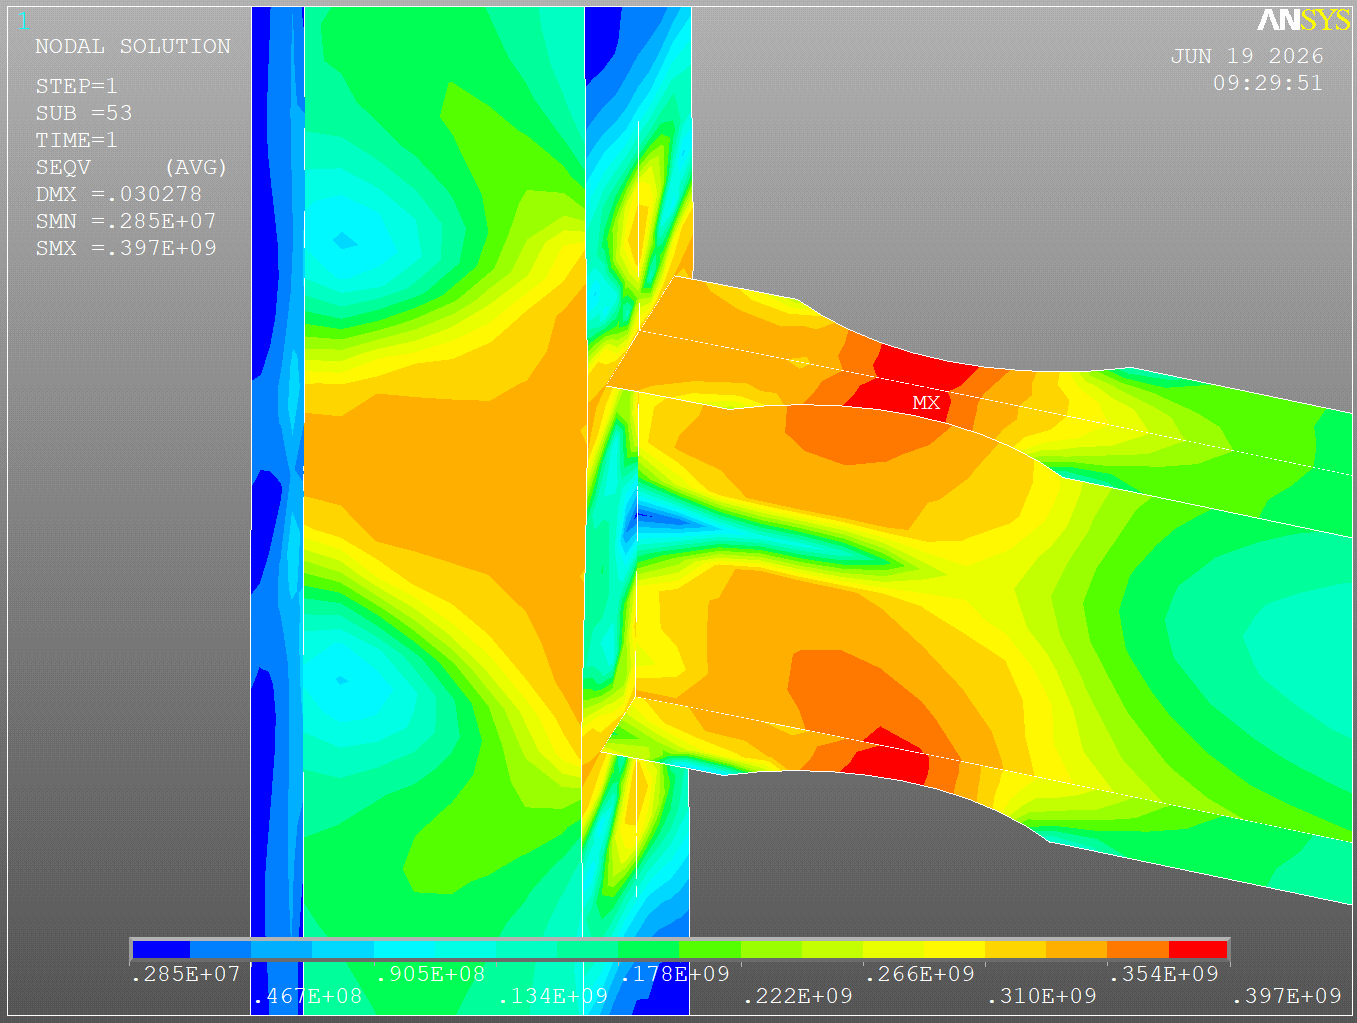
Figure 2: Yielding in RBS
The load-displacement trend, peak resistance, and deformation characteristics should be evaluated together to determine the validity of the model.
If required, the percentage error may be computed using:
A low error percentage suggests that the selected element formulation, material models, and boundary conditions are appropriate for representing the tested specimen.
5. Conclusion
The numerical results obtained from the ANSYS APDL model show good agreement with the experimental data. The minor discrepancy in the results validates the reliability of the modeling methodology, confirming that the FE model can be effectively used for further parametric studies.
[1] For More Information See “Define ELEMENT in ANSYS” Tutorial Video
[2] For More Information See “Define MATERIAL in ANSYS” Tutorial Video
| Error (%) = | ∣Experimental Result −FEA Result∣ | × | 100 |
| Experimental Result |