

. Introduction
This report presents the validation process of a Finite Element (FE) model developed to simulate the structural behavior of Lead Rubber Bearing. The objective is to verify the accuracy of the numerical model by comparing its response with experimental data obtained from laboratory testing.
The validation approach focuses on key structural response parameters,
including load capacity and displacement behavior, to assess the ability of the FE model to reproduce the observed experimental performance. A strong correlation between the numerical and experimental results provides confidence in the model’s predictive capabilities.
1.2 Lead Rubber Bearing
The seismic base isolation system increases the fundamental period of the structure and dissipate the energy produced by the earthquake, limiting the forces transferred to the superstructure.
The lead-rubber seismic isolation system is an effective passive control device designed to reduce the transmission of earthquake forces to structures.
It is installed between the foundation and the superstructure to increase flexibility and lengthen the natural period of the building.
The rubber layers provide lateral deformability, while the lead core contributes significant energy dissipation through hysteretic damping.
This system improves the seismic performance of structures by limiting force demands and controlling displacement responses.
It is widely used in important buildings and critical facilities where high seismic resilience is required.
Key Features
- Reduces seismic force transfer to the structure
- Provides high energy dissipation capacity
- Increases lateral flexibility and seismic isolation
- Improves overall structural performance during earthquakes
- Suitable for essential and sensitive structures
2. Experimental Specimen Specifications
To perform model validation, it is essential to identify a laboratory specimen for which we have access to its primary data and outputs, and in which we have sufficient confidence in its results. After conducting research, we selected a study titled Robinson WH, Tucker AG. Test results for lead-rubber bearings for WM. Clayton building, Toe Toe bridge and Waiotukupuna bridge. Bull NZ Natl Soc Earthq Eng 1981;14(1):21–33., which is a laboratory investigation with reliable and trustworthy results. This report aims to validate our Finite Element (FE) model against the experimental data from this selected study.
2.1 Geometric Properties
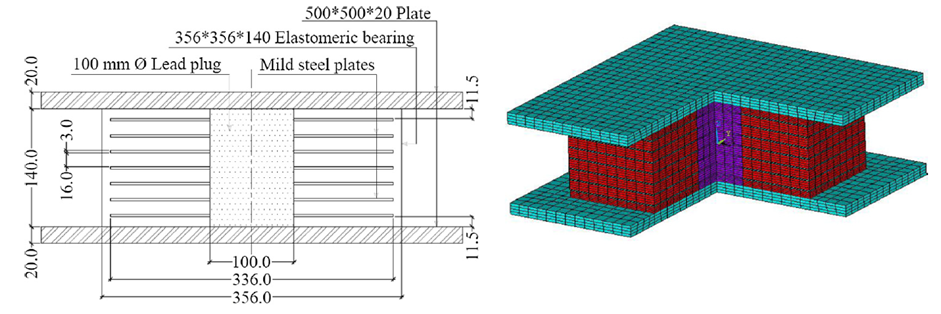
In order to validate the FE implementation process, the results obtained through FE analysis are compared with those measured through experiments. Two full-scale lead-rubber bearings with the experimental data available are analyzed here using the proposed 3D FE procedure. The first bearing is a lead-rubber shear damper consisting of a 100 mm-diameter lead core inserted in the center of a 356 _ 356 _ 140 mm elastomeric bearing.
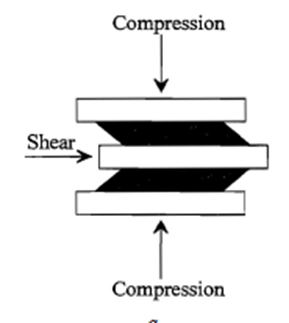
Figure 1: Dimensions of the single story test specimens
2.2 Material Properties
According Base article for using Rubber, Lead and Steel
Steel material
Young’s modulus = 205 GPa
Tangent modulus = 20.5 GPa
Yield stress = 275MPa
Poisson’s ratio = 0.28
Density = 7850 kg/m3
Lead material:
Young’s modulus = 16 GPa
Tangent modulus = 45 MPa
Yield stress = 12 MPa
Poisson’s ratio = 0.44
Density = 11,300 kg/m3
Rubber material:
Poisson’s ratio = 0.499
Density = 1150 kg/m3
2.3 Experiment Loading Systems
Fixed Bottom of Frame and Using hydraulic Actuator to apply Horizontal Displacement.
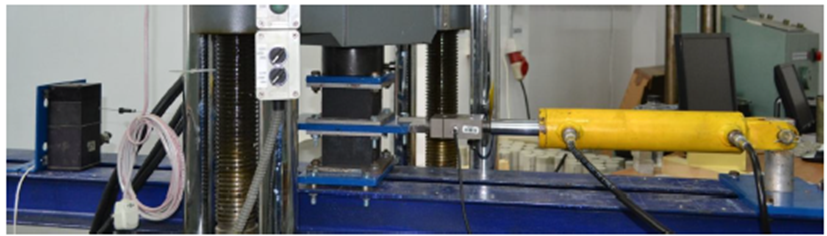
Figure 2: Experiment Loading Systems
2.4 Result of Experiment Test
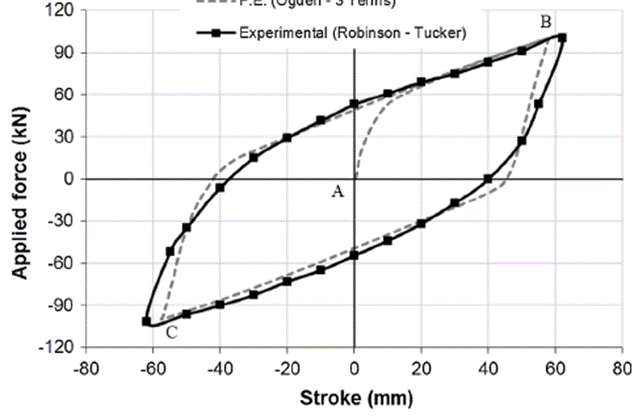
The key performance characteristic of a Lead Rubber Bearing, as demonstrated by the test control procedures, is the relationship between the story shear and story drift Or Capacity Curve Of Frame.
Figure 2: Capacity Curve of Experimental Test Result
Figure 2: Experiment Loading Systems
3. Finite Element Modeling (ANSYS APDL)
3.1 Overview of ANSYS APDL
ANSYS Parametric Design Language (APDL) is a powerful scripting language used to automate the finite element analysis process. Unlike the standard GUI, APDL allows for high-precision parametric modeling, which is essential for structural validation. It offers advanced capabilities for defining complex geometries, material behaviors, and loading conditions, ensuring that the numerical model accurately represents the experimental setup.
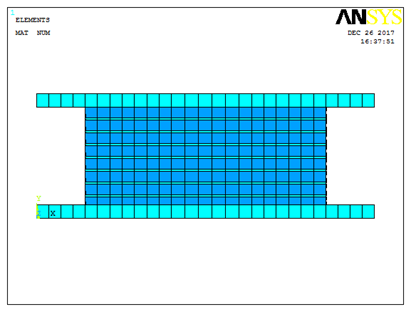
Advantages of using APDL Scripting:
• Automation: Enables seamless iteration of geometry, mesh density, and boundary conditions, supporting complex parametric studies and optimization through scripting.
• Flexibility: Offers precise control over material nonlinearities, advanced contact elements, and custom loading protocols.
Repeatability: Ensures that modeling steps are documented and•
reproducible, reducing human error and crucial for validation studies.
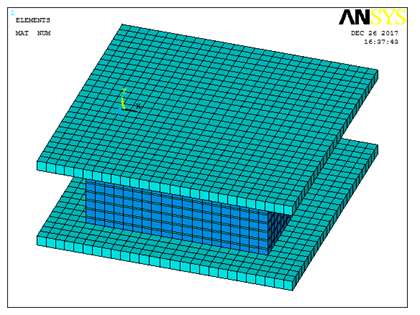
Figure 2: Modeling Experimental Specimen in ANSYS
- Modeling (Step-by-Step)
Step by Step modeling Lead Rubber Bearing in ANSYS
Figure 2: Guide for draw Solid by Dimension Method
| Step | Description’s | |
| 1: Element For Rubber, Lead and Steel (Sheet) | Soild 182[1] | |
| 2:Material For Rubber, Lead and Steel (Sheet) | Material 1&2&3 Define Multilinear Material[2] | |
| 3:Modeling | Solid Method | |
| 4:Meshing | Quad Mapped | |
| 5:Load, Constraint and Analysis Type | Nonlinear static Analysis by Displacement Control | |
| 6:Result | Plot and Capacity Curve |
Figure 2: Plot Result after Analysis
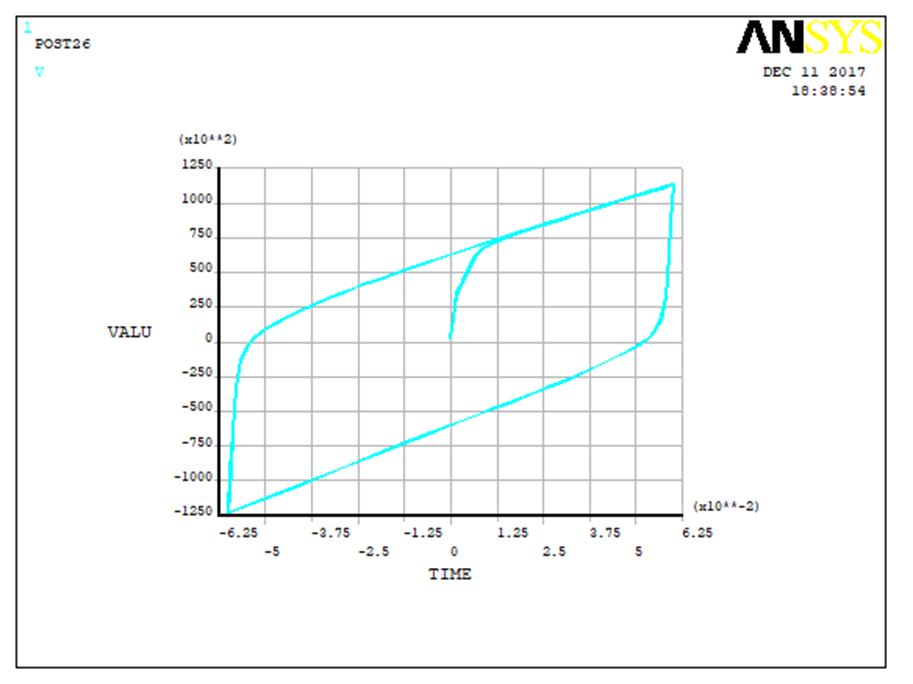
Figure 2: Histersis Curve of Finite Element Model Result
4. Results Comparison
4.1 Quantitative Data
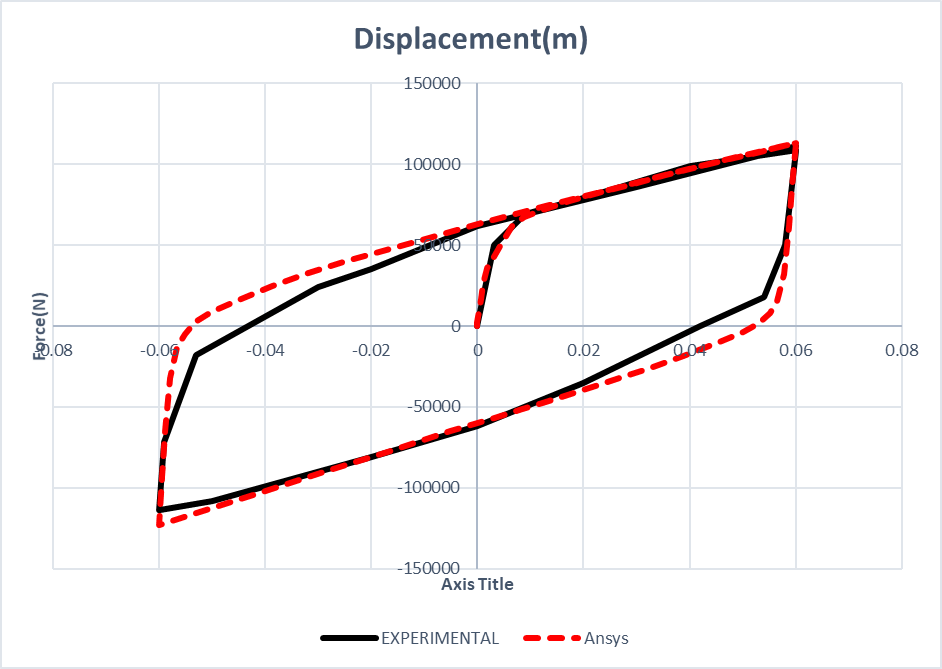
Figure 3: Load-Displacement Curve Comparison Graph
The comparison between the experimental and numerical results indicates that the FE model captures the overall structural response with satisfactory accuracy.
| Comparison Parameter | Experimental | FEA Result | Error[3] |
| Result | (ANSYS) | (%) | |
| Peak Load (N) | 117400 | 113180 | 3.5 |
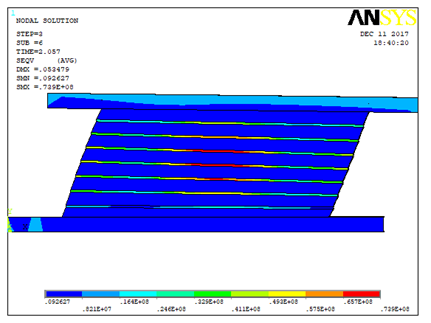
Figure 2: FEM Displacement Result
The load-displacement trend, peak resistance, and deformation characteristics should be evaluated together to determine the validity of the model.
If required, the percentage error may be computed using:
A low error percentage suggests that the selected element formulation, material models, and boundary conditions are appropriate for representing the tested specimen.
5. Conclusion
The numerical results obtained from the ANSYS APDL model show good agreement with the experimental data. The minor discrepancy in the results validates the reliability of the modeling methodology, confirming that the FE model can be effectively used for further parametric studies.
[1] For More Information See “Define ELEMENT in ANSYS” Tutorial Video
[2] For More Information See “Define MATERIAL in ANSYS” Tutorial Video
| Error (%) = | ∣Experimental Result −FEA Result∣ | × | 100 |
| Experimental Result |