


📑 Table of Contents
📋 Product Overview
📖 Introduction
📊 Validation Results
. Introduction Castellated Section in ANSYS APDL
This numerical study employs the Finite Element Method (FEM) within the ANSYS APDL environment to perform a rigorous validation of structural behavior. By systematically developing high-fidelity models, this approach ensures precise correlation between experimental observations and numerical predictions. Utilizing advanced non-linear solvers and parametric scripting, the modeling process captures complex failure mechanisms, enabling a comprehensive verification of structural performance. This methodology establishes a robust framework for assessing the accuracy of computational simulations against laboratory-tested experimental data.
Castellated Section in ANSYS APDL
Castellated beams are innovative structural members formed by cutting a standard I-beam along its web in a longitudinal pattern and rejoining the two halves to create a series of hexagonal or circular openings. Their unique design offers several structural and economic advantages of Castellated Section in ANSYS APDL:
- Optimized Stiffness-to-Weight Ratio: The increased beam depth significantly enhances the moment of inertia and bending stiffness without adding extra steel, leading to a highly efficient use of material.
- Integrated Service Routing: The large web openings provide natural pathways for utility services (HVAC, plumbing, and electrical), reducing the overall floor-to-floor height in multi-story buildings.
- Enhanced Structural Performance: By effectively placing material away from the neutral axis, these beams offer superior load-carrying capacity compared to their parent solid-web sections of equivalent weight.
- Specialized Failure Mechanisms: Due to the geometric discontinuity in the web, these sections exhibit unique failure modes that require careful engineering analysis, most notably:
- Vierendeel Bending: Occurring when high shear forces cause localized bending at the opening joints.
- Web-Post Buckling: Resulting from the reduced stiffness of the web segments between consecutive openings under concentrated shear or compression.
- Lateral-Torsional Buckling: Influenced by the modified cross-sectional properties and reduced shear stiffness.
- Design Flexibility: The ability to vary opening sizes, spacing, and the overall geometry allows engineers to tailor the beam behavior to specific architectural and structural demands.
- Modern Applications: Widely utilized in long-span roof systems and floor structures where aesthetic appeal, reduced self-weight, and functional utility are primary design drivers.
2. Experimental Specimen Specifications
2.1 Geometric Properties
The beam and column members were made of CPE180 sections:
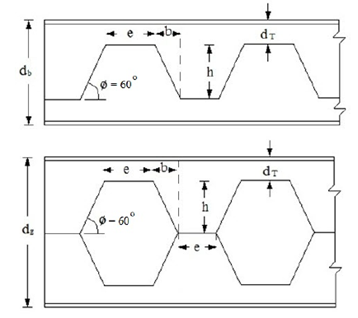
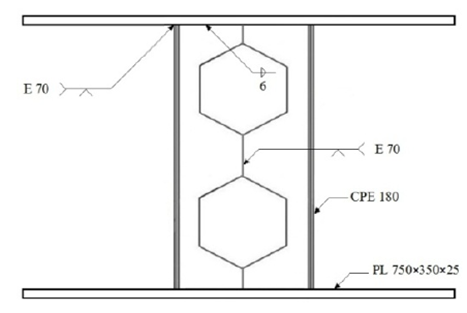
Figure 1: Dimensions of the single story test specimens
2.2 Material Properties
The material properties used in the experimental specimens were reported separately for the two tests.
Yield stress: 340 N/mm²
Young’s modulus: 200 kN/mm²
.
2.3 Experiment Loading Systems
The specimens of Castellated Section in ANSYS APDL were tested using a pseudo dynamic loading system. The setup included:
- a central microcomputer control unit,
- hydraulic jack,
- load cell,
- displacement transducers,
- and strain gauges including linear gauges and rectangular rosettes.
The displacement transducers were used to monitor:
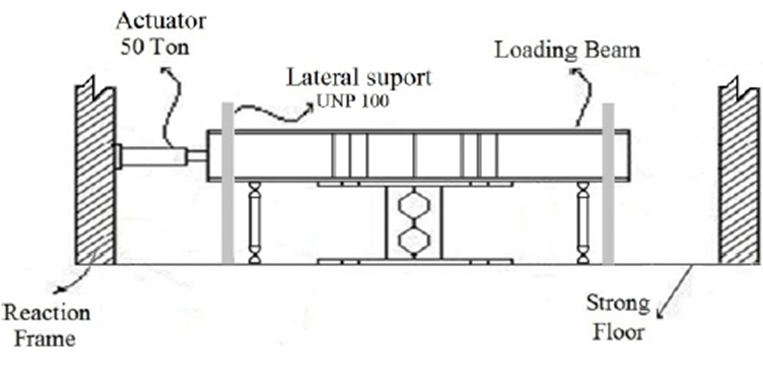
Figure 2: Experiment Loading Systems
2.4 Result of Experiment Test
The key performance characteristic of a Castellated Section, as demonstrated by the test control procedures, is the relationship between the story shear and story drift Or Capacity Curve Of Castellated Section in ANSYS APDL Frame.
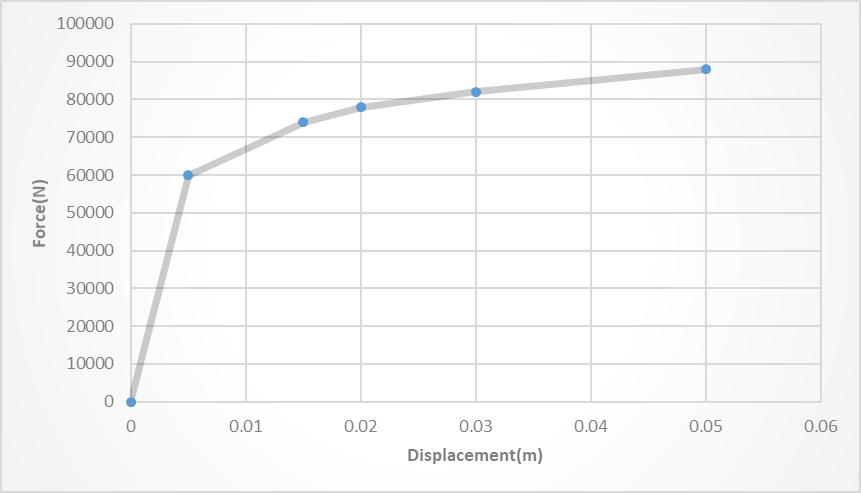
Figure 2: Capacity Curve of Experimental Test Result
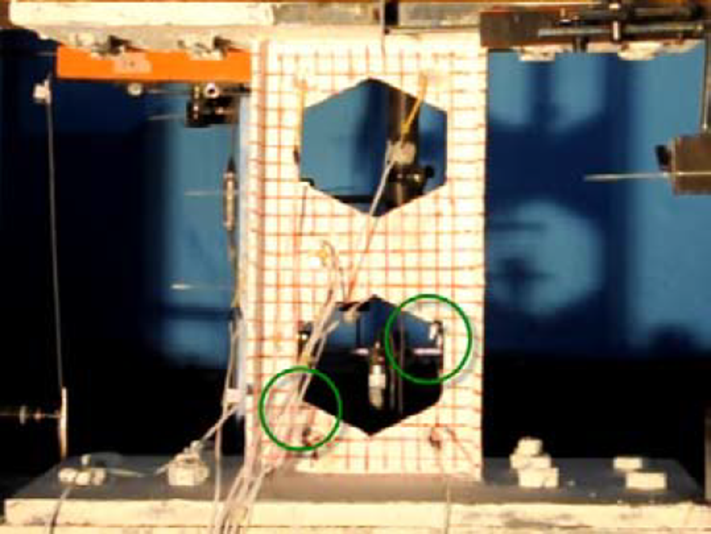
Figure 2: Experiment Specimen Systems
3. Finite Element Modeling (ANSYS APDL)
3.1 Overview of ANSYS APDL
ANSYS Parametric Design Language (APDL) is a powerful scripting language used to automate the finite element analysis process. Unlike the standard GUI, APDL allows for high-precision parametric modeling, which is essential for structural validation. It offers advanced capabilities for defining complex geometries, material behaviors, and loading conditions, ensuring that the numerical model accurately represents the experimental setup.
Advantages of using APDL Scripting:
• Automation: Enables seamless iteration of geometry, mesh density, and boundary conditions, supporting complex parametric studies and optimization through scripting.
• Flexibility: Offers precise control over material nonlinearities, advanced contact elements, and custom loading protocols.
Repeatability: Ensures that modeling steps are documented and•
reproducible, reducing human error and crucial for validation studies.
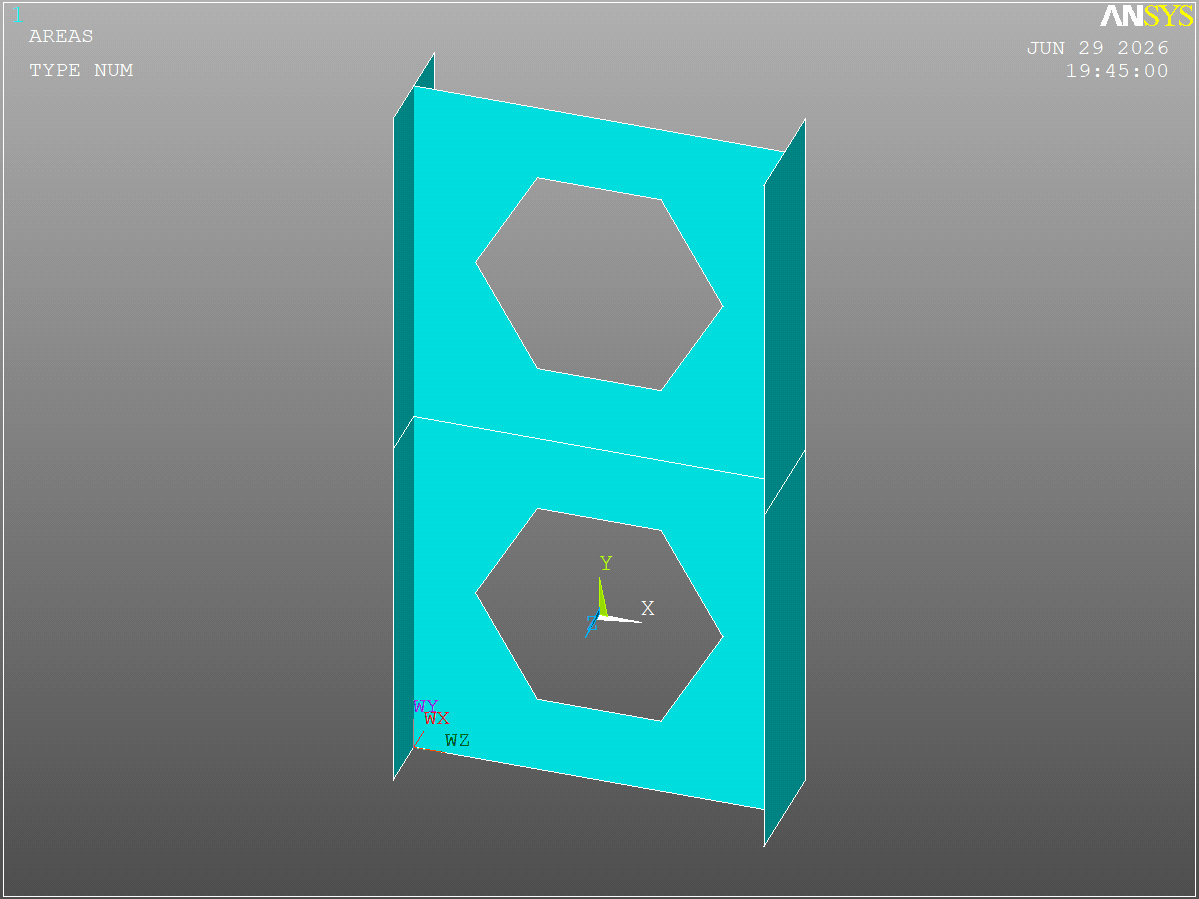
Figure 2: Modeling Experimental Specimen in ANSYS
- Modeling (Step-by-Step)
Step by Step modeling Castellated Section in ANSYS
Use 2 Real Constant for Supply Thickness of Element
| Topic | No. Real Constant | Value(m) | |
| Beam | Thickness of Web | 1 | 0.0085 |
| Thickness of Flange | 2 | 0.014 |
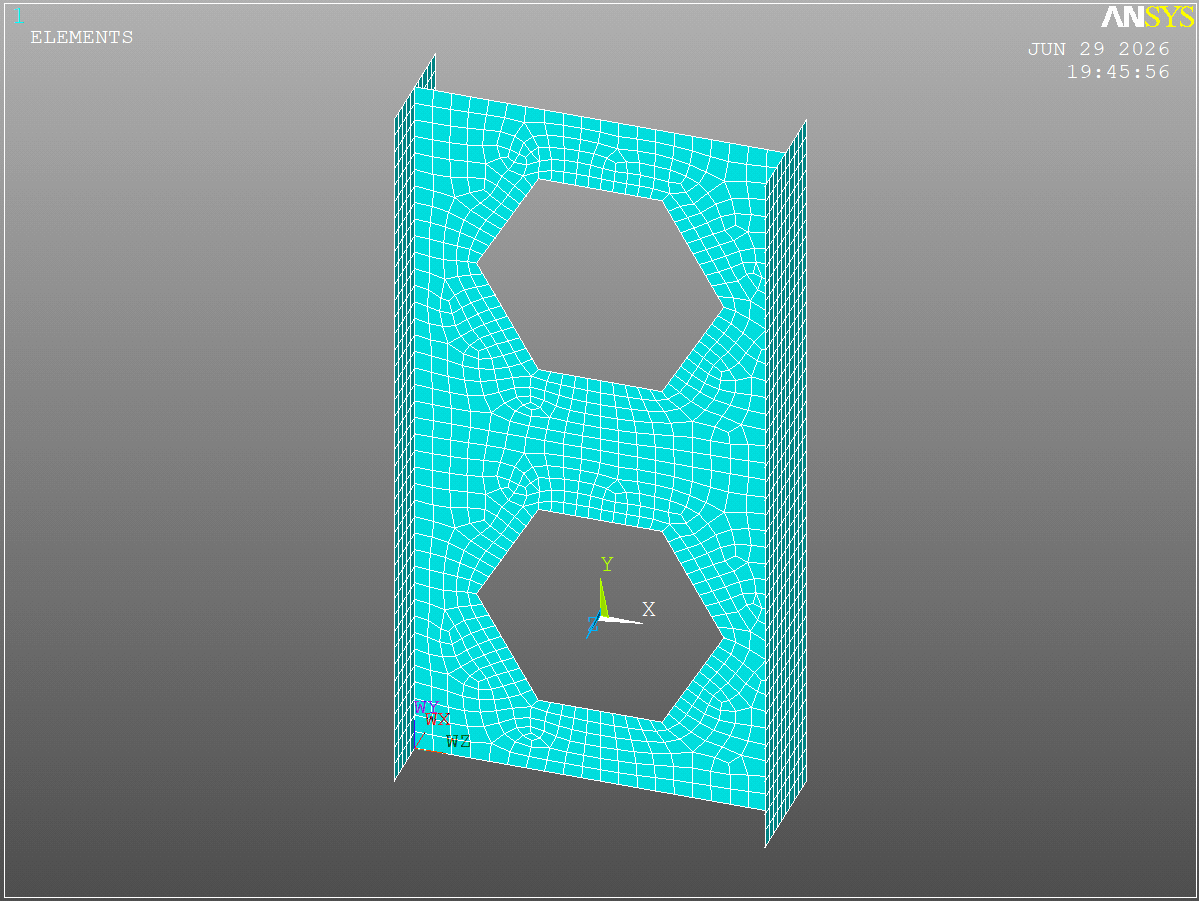
Figure 2: Guide for draw Area by Dimension Method
| Step | Description’s | |
| 1: Element For Column, Beam, Diagonal and Knee Member | SHEEL43[1] | |
| 2:Material For Column, Beam, Diagonal and Knee Member | Material 1 Define Multilinear Material[2] | |
| 3:Modeling | Area Method | |
| 4:Meshing | Quad Mapped | |
| 5:Load, Constraint and Analysis Type | Nonlinear static Analysis by Displacement Control | |
| 6:Result | Plot and Capacity Curve |
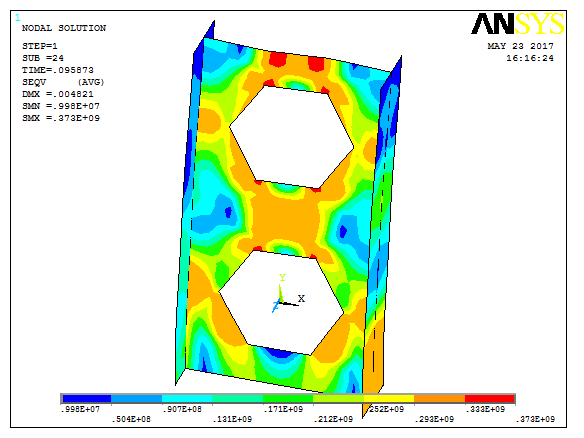
Figure 2: Plot Result after Analysis
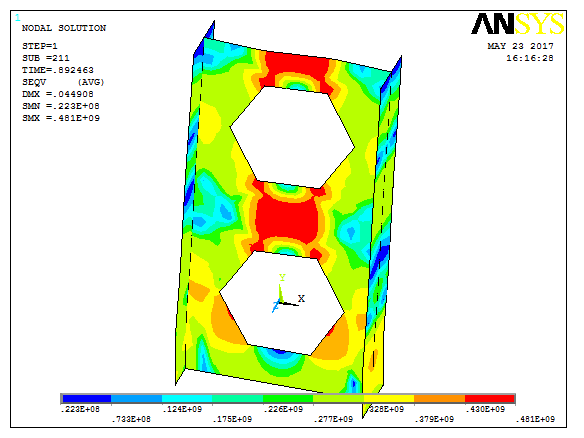
Figure 2: Capacity Curve of Finite Element Model Result
4. Results Comparison
4.1 Quantitative Data
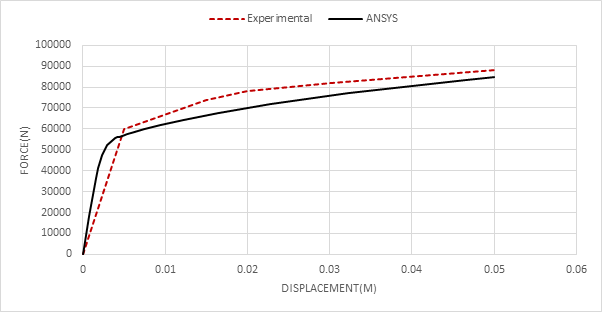
Figure 3: Load-Displacement Curve Comparison Graph
The comparison between the experimental and numerical results indicates that the FE model captures the overall structural response with satisfactory accuracy.
| Comparison Parameter | Experimental | FEA Result | Error[3] |
| Result | (ANSYS) | (%) | |
| Peak Load (N) | 88000 | 84790 | 3.64 |
Figure 2: Comparison Between FEM and TEST
The load-displacement trend, peak resistance, and deformation characteristics should be evaluated together to determine the validity of the model.
The most critical validation criterion is whether the FE model can capturein Fig 2 and the ductile cyclic response observed experimentally.
5. Conclusion
The numerical results obtained from the ANSYS APDL model show good agreement with the experimental data. The minor discrepancy in the results validates the reliability of the modeling methodology, confirming that the FE model can be effectively used for further parametric studies.
[1] For More Information See “Define ELEMENT in ANSYS” Tutorial Video
[2] For More Information See “Define MATERIAL in ANSYS” Tutorial Video
| Error (%) = | ∣Experimental Result −FEA Result∣ | × | 100 |
| Experimental Result |
Shayanfar, M. A., Barkhordari, M. A., & Rezaeian, A. R. (2011). Experimental study of cyclic behavior of composite vertical shear link in eccentrically braced frames. Steel and Composite Structures, 12(1), 13–29. https://doi.org/10.1191/1.3553337
FAQ Section
What is a Castellated Section?
Why is Castellated Section
Validation important?
Which ANSYS elements are used?
Is the APDL source code included?
Is the experimental paper included?