


Welding Steel Connections Validation in Ansys
Modeling (Step-by-Step)
- Introduction
Welding Steel Connections Validation in Ansys
- Experimental Specimen Specifications
2.1 Geometric Properties
2.2 Material Properties
2.3 Experiment Loading Systems
2.4 Result of Experiment Test
- Finite Element Modeling (ANSYS APDL)
- Overview of ANSYS APDL
- Modeling (Step-by-Step)
- Results Comparison
4.1 Quantitative Data
- Conclusion
1. Introduction
This report presents the validation process of a Finite Element (FE) model developed to simulate the structural behavior of welded steel connections. The objective is to verify the accuracy of the numerical model by comparing its response with experimental data. A strong correlation between the numerical and experimental results provides confidence in the model’s predictive capabilities for analyzing the performance of welded steel connections under various loading conditions.Welding Steel Connections Validation in Ansys
One of the process that become the cause of residual stress in the structure is welding. Inner residual stress in weld and its near zone become rise of consecutive warming and cooling under direct heat zone and near of it and lock of displacement in some ways zone.Welding Steel Connections Validation in Ansys
Welding Steel Connections Validation in Ansys
Welded steel connections are fundamental components in steel structures, offering efficient load transfer and contributing significantly to the overall structural integrity and performance, especially under lateral loads such as wind and seismic forces. These connections are critical for ensuring the stability and ductility of the structure. This report specifically focuses on validating an FE model simulating such connections.
2. Experimental Specimen Specifications
To perform model validation, it is essential to identify a laboratory specimen for which we have access to its primary data and outputs, and in which we have sufficient confidence in its results. After conducting research, we selected a study titled “Performance of unstiffened Welding Steel Connections under cyclic quasi-static loading” by ADAM S.LUBELL University of British Colombia, which is a laboratory investigation with reliable and trustworthy results. This report aims to validate our Finite Element (FE) model against the experimental data from this selected study.
2.1 Geometric Properties
The experimental specimen analyzed in this validation process is a welded steel plate to an angle connection, described as having a thick weld and a wide gap. The test was conducted in accordance with the ASTM A370 standard.Welding Steel Connections Validation in Ansys
2.2 Material Properties
According Base Test Report Use St 37 Steel Material
2.4 Result of Experiment Test
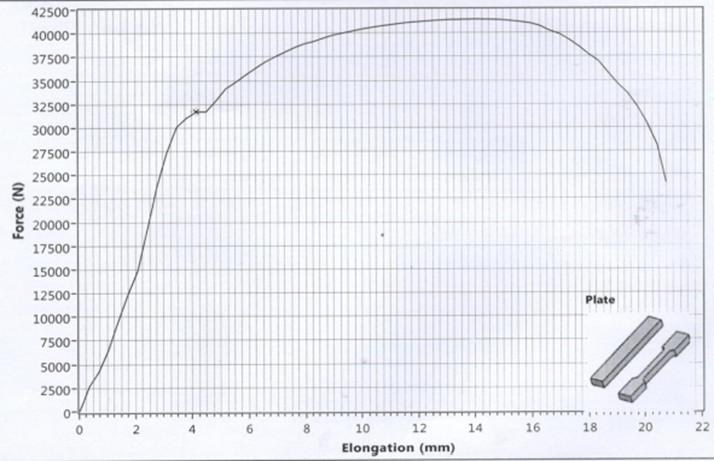
The key performance characteristic of a Welding Steel Connections, as demonstrated by the test control procedures, is the relationship between the Forde and Elongations Or Capacity Curve Of Frame.
Figure 2: Capacity Curve of Experimental Test Result
Figure 2: Experiment Loading Systems
3. Finite Element Modeling (ANSYS APDL)
3.1 Overview of ANSYS APDL
ANSYS Parametric Design Language (APDL) is a powerful scripting language used to automate the finite element analysis process. Unlike the standard GUI, APDL allows for high-precision parametric modeling, which is essential for structural validation. It offers advanced capabilities for defining complex geometries, material behaviors, and loading conditions, ensuring that the numerical model accurately represents the experimental setup. Welding Steel Connections Validation in Ansys
Advantages of using APDL Scripting:
• Automation: Enables seamless iteration of geometry, mesh density, and boundary conditions, supporting complex parametric studies and optimization through scripting.
• Flexibility: Offers precise control over material nonlinearities, advanced contact elements, and custom loading protocols.
Repeatability: Ensures that modeling steps are documented and•
reproducible, reducing human error and crucial for validation studies.
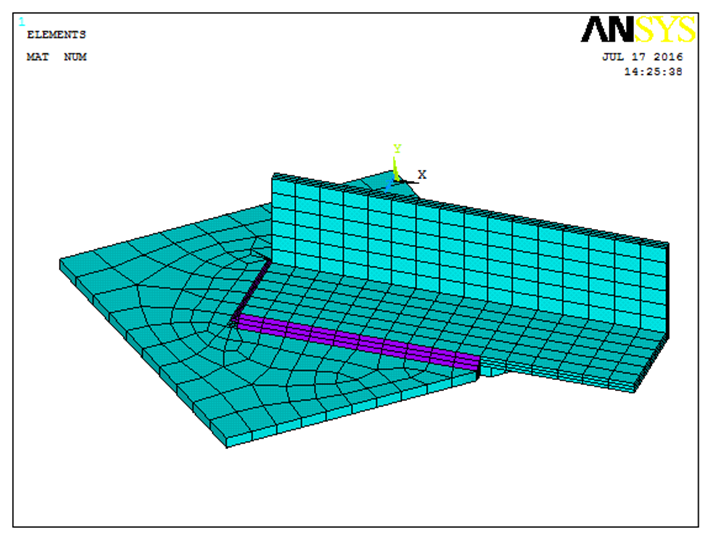
Figure 2: Modeling Experimental Specimen in ANSYS
- Modeling (Step-by-Step)
Step by Step modeling Welding Steel Connections in ANSYS
- Determining the type of analysis
- Introducing the required element types
- Defining geometric constants (flange and web thickness for different sections)
- Defining steel material properties (stress-strain curve)
- Modeling the geometry of the structure
- Coupling/merging adjacent nodes
- Defining boundary conditions and lateral bracing of the beam
- Applying a unit load to the roof and performing the unit load analysis considering pre-stress effects
- Performing buckling analysis considering the first mode shape
- Applying displacement to the roof
- Activating large deformation effects and specifying the number of substeps
- Performing the final analysis
Figure 2: Solid 185 Element use for Steel Plate
Figure 2: Solid 70 Element use for Welding Line
| Step | Description’s | |
| 1: Element For Column, Beam and Sheet 2:Modeling Weld Line | 1:Solid 185[1] 2:Solid 70 | |
| 2:Material For Column, Beam and Wall(Sheet) | Material 1&2 Define Multilinear Material[2] | |
| 3:Modeling | Solid Method | |
| 4:Meshing | Quad Mapped | |
| 5:Load, Constraint and Analysis Type | Nonlinear static Analysis by Displacement Control | |
| 6:Result | Plot and Capacity Curve |
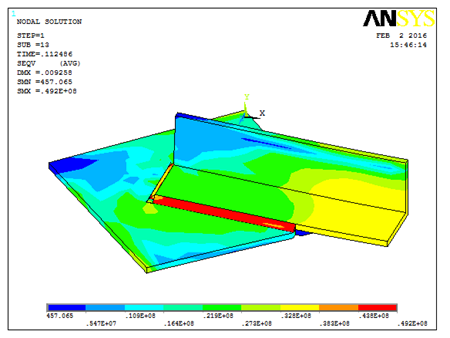
Figure 2: Plot Result after Analysis
Figure 2: Capacity Curve of Finite Element Model Result
4. Results Comparison
4.1 Quantitative Data
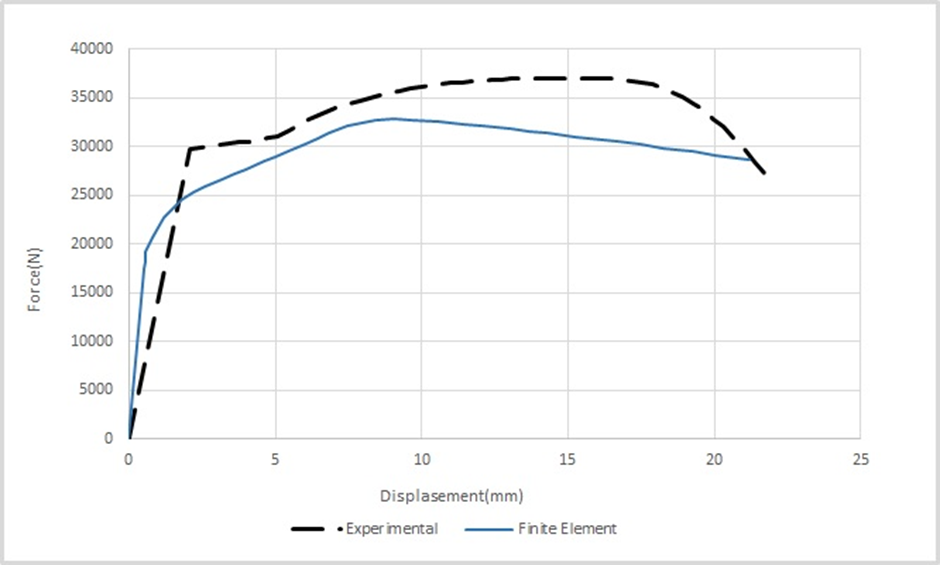
Figure 3: Load-Displacement Curve Comparison Graph
The comparison between the experimental and numerical results indicates that the FE model captures the overall structural response with satisfactory accuracy.
| Comparison Parameter | Experimental | FEA Result | Error[3] |
| Result | (ANSYS) | (%) | |
| Peak Load (N) | 26100 | 24900 | 4.5 |
Figure 2: Comparison Between FEM and TEST
The load-displacement trend, peak resistance, and deformation characteristics should be evaluated together to determine the validity of the model.
If required, the percentage error may be computed using:
A low error percentage suggests that the selected element formulation, material models, and boundary conditions are appropriate for representing the tested specimen.
5. Conclusion
The numerical results obtained from the ANSYS APDL model show good agreement with the experimental data. The minor discrepancy in the results validates the reliability of the modeling methodology, confirming that the FE model can be effectively used for further parametric studies.
[1] For More Information See “Define ELEMENT in ANSYS” Tutorial Video
[2] For More Information See “Define MATERIAL in ANSYS” Tutorial Video
| Error (%) = | ∣Experimental Result −FEA Result∣ | × | 100 |
| Experimental Result |
ASTM International. ASTM A370-24. Standard Test Methods and Definitions for Mechanical Testing of Steel Products.
FAQ Section
- What is a Welding Steel Connections?
- Why is Welding Steel Connections
- Validation important?
- Which ANSYS elements are used?
- Is the APDL source code included?
- Is the experimental paper included?
Related Validation Projects
Lead Rubber Bearing Validation in ANSYS APDL – Download Complete FEM Project